4
Cohort Analysis
Agent 04 - Cohort Analysis
Real Patients. Real Outcomes. Not a black box.
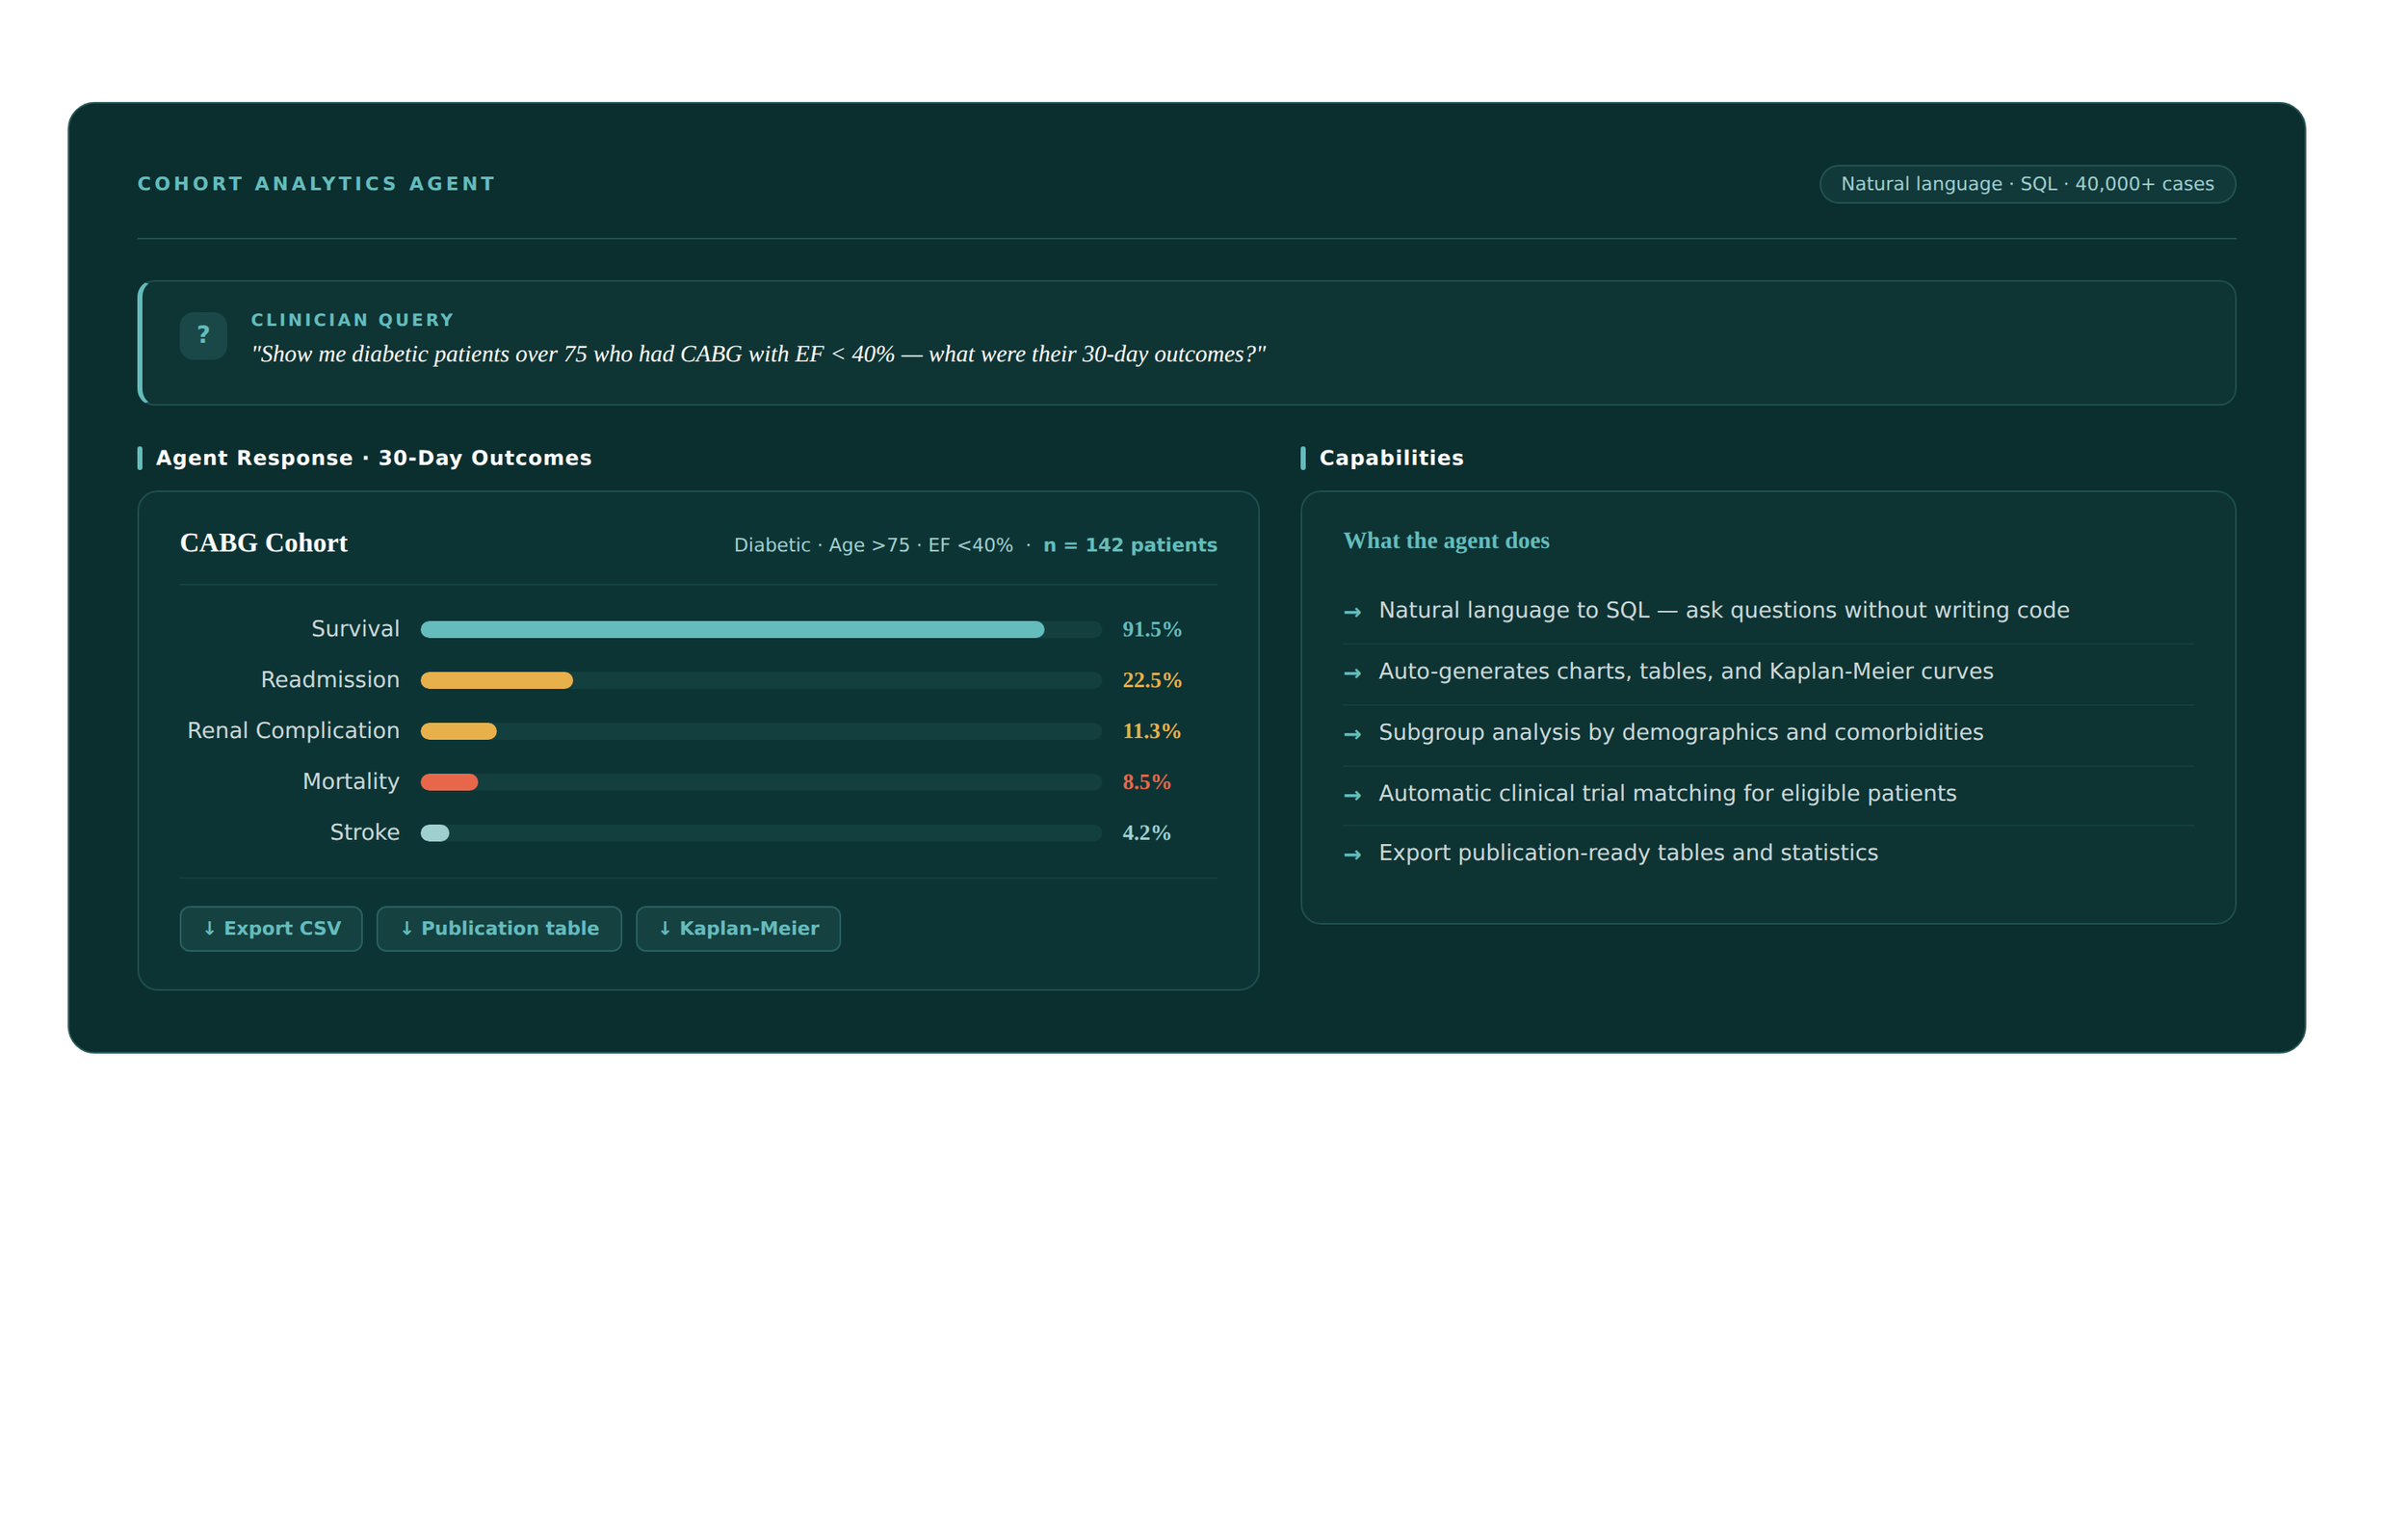
The Cohort Analytics Agent surfaces matched patient cases with real-world observed outcomes from the reference population letting clinicians ask any clinical question in plain English and get instant answers, charts, and Kaplan-Meir curves backed by structured registry data.
-
Clinicians can ask any cohort question in plain English no SQL, no data analyst required. Example queries include outcome lookups ("30-day mortality for diabetic CABG patients over 75"), comparative subgroup analysis ("readmission rates for EF under 40% versus preserved EF"), and temporal trends ("how have LIMA-to-LAD graft outcomes changed over the last five years"). The agent translates each question into a validated query, runs it against the reference population, and returns the result with the sample size visible.
-
The agent returns structured visual output — typically a summary metric table, comparative bar chart, or Kaplan-Meier curve — along with the matched cohort size and the filter criteria used. Every result is shown with the underlying n so the clinician knows how robust the signal is. Every chart, table, and statistic is one-click exportable as CSV, a publication-ready table, or a rendered Kaplan-Meier plot.
-
The agent queries a reference population of 40,000+ cardiovascular treatment cases with structured registry fields, imaging metadata, and procedural outcomes. All data is de-identified and queries are read-only — no agent ever modifies the underlying registry. When a question falls outside the available data, the agent says so explicitly rather than fabricating a number.